Notice of the People’s Government of Beijing Municipality on Printing and Distributing the Implementation Plan of Beijing Municipality for Coordinating Epidemic Prevention and Control and Stabilizing
Jing Zheng Fa [2022] No.23
District People’s governments, municipal government commissions, offices and bureaus, and municipal institutions:
The "Implementation Plan for Overall Prevention and Control of Epidemic Situation and Stable Economic Growth in Beijing" is hereby printed and distributed to you, please earnestly implement it.
the people’s government of beijing city
June 2, 2022
Beijing’s implementation plan for coordinating epidemic prevention and control and stabilizing economic growth
In order to implement the requirements of the CPC Central Committee that "the epidemic situation should be prevented, the economy should be stabilized and the development should be safe" and the relevant policies and measures for stabilizing the economy in the State Council, effectively coordinate the epidemic prevention and control and economic and social development, coordinate the development and safety, stabilize the growth and market players to ensure employment, ensure the economic operation in a reasonable range, adhere to the "five-child" linkage service and integrate into the new development pattern, and promote the development of the capital in the new era, this implementation plan is specially formulated.
First, continue to increase efforts to help enterprises tide over difficulties and optimize the business environment, and make every effort to stabilize the economic fundamentals.
(A) the tax refund "direct enjoyment"
1. Strictly implement the national VAT credit and tax refund policy, take the initiative to serve, accurately push information "one-on-one", and handle the whole process online to ensure that the eligible enterprise stock credit tax should be refunded before June 30, 2022. (Responsible units: Beijing Municipal Taxation Bureau, Municipal Finance Bureau, Business Management Department of People’s Bank of China)
(B) social insurance premiums and housing provident fund "should be slowed down."
2. In accordance with the national social insurance premium holdover policy and the requirements for expanding the scope, enterprises in poor industries, small and medium-sized enterprises with difficulties in scientific and technological innovation, other small and medium-sized enterprises with difficulties in production and operation affected by the epidemic, individual industrial and commercial households participating in the basic old-age insurance for enterprise employees, institutions and social organizations will be holdover, and the application conditions of enterprises with difficulties will be clarified, the scope of enjoyment will be expanded, and the handling procedures will be simplified by means of voluntary application and written commitment. The holdover period of pension, unemployment and work-related injury insurance premiums will be until the end of 2022. (Responsible units: Municipal Human Resources and Social Security Bureau, Municipal Finance Bureau and Beijing Taxation Bureau)
3. Enterprises and other employers affected by the epidemic can apply for holdover of housing provident fund according to regulations, and the holdover period is from April to December, 2022. During the holdover period, the paid workers will normally withdraw and apply for housing provident fund loans, which will not be affected by holdover. Workers who rent commercial housing without their own houses in this city can withdraw the housing provident fund according to the actual rent paid, which is not limited by the monthly deposit amount of the depositor. If the personal housing provident fund loan cannot be repaid normally due to the epidemic situation, it will not be overdue, and the credit record will not be affected, and the penalty interest will be exempted. (Responsible unit: Municipal Housing Provident Fund Management Center)
(C) State-owned rent relief "enjoy upon application"
4. In 2022, small and micro enterprises and individual industrial and commercial households that rent all kinds of state-owned houses in Beijing, which are registered in Beijing or pay taxes in Beijing, will be reduced or exempted for three months. Among them, those who rent state-owned houses in Chaoyang, Haidian, Fengtai, Fangshan, Tongzhou and Daxing, which are listed as high-risk areas in the epidemic, will be reduced or exempted for six months. Eligible supermarket chains, convenience stores and catering enterprises shall be implemented in stores. Collective enterprises in this Municipality shall be implemented by each district in light of the actual situation. If the science and technology incubators renting non-state-owned houses reduce or exempt the rent for small and medium-sized enterprises and individual industrial and commercial households, they will be subsidized according to 50% of the total rent reduction and exemption, of which 20% will be borne by the municipal level and 30% by the district level. Encourage all districts to give certain subsidies to non-state-owned housing owners or business management entities that reduce or exempt rents for small and medium-sized enterprises and individual industrial and commercial households. Municipal State-owned Assets Supervision and Administration Commission (SASAC) and all districts set up special classes for rent reduction and exemption, announce contact information, coordinate the implementation of supervision policies, and ensure that rent-free measures benefit the final tenant operators. (Responsible units: Municipal State-owned Assets Supervision and Administration Commission, Municipal Bureau of Organs Affairs, Municipal Science and Technology Commission, Zhongguancun Management Committee, Municipal Bureau of Commerce, Municipal Finance Bureau, Beijing Economic and Technological Development Zone Management Committee, and district governments)
(D) Water and electricity "arrears for non-stop"
5. For small and micro enterprises and individual industrial and commercial households that fail to pay in time due to the epidemic, the overdue payment period will be until the end of 2022, and the late payment fee will be exempted during the deferred payment period. Reduce the average broadband and private line tariffs of small and medium-sized enterprises by another 10%. (Responsible units: Municipal Urban Management Committee, Municipal Water Affairs Bureau, Municipal Market Supervision Bureau, Municipal Bureau of Economy and Information Technology, Municipal Communications Administration, Beijing Economic and Technological Development Zone Management Committee, and district governments)
(E) Run a "financing through train"
6. In 2022, the growth rate of Pratt & Whitney small and micro loans was more than 10 percentage points higher than that of various loans. Combine online and offline to improve the convenience and coverage of the first loan subsidy. We will implement the policy of shortening the acceptance period of commercial bills from one year to six months and increase rediscount. (Responsible units: Business Management Department of People’s Bank of China, Beijing Banking Insurance Regulatory Bureau, Municipal Financial Supervision Bureau, Municipal Bureau of Economic and Information Technology, Municipal Government Affairs Service Bureau and Municipal Finance Bureau)
7. Encourage financial institutions to postpone the repayment of principal and interest for small and medium-sized enterprises, individual industrial and commercial households, truck drivers’ loans and personal housing and consumer loans affected by the epidemic, simplify the application procedures, support online processing, not downgrade the loan risk classification due to the epidemic factors, not affect the credit record, and waive the penalty interest. (Responsible units: Beijing Banking Insurance Regulatory Bureau, Business Management Department of People’s Bank of China, and Municipal Financial Supervision Bureau)
8. Increase the support of financing guarantee for small and medium-sized enterprises. If the newly applied bank loans for small and medium-sized enterprises in the service industry that are greatly affected by the epidemic are guaranteed by government financing guarantee institutions in 2022, the guarantee fee will be charged at the rate of 0.5%, and the guarantee fee for policy-based entrepreneurial guarantee projects will be exempted, and the government financing guarantee institutions will provide compensation of no more than 20% of the total compensation actually incurred. (Responsible units: Municipal Finance Bureau, Municipal Financial Supervision Bureau, Beijing Banking Insurance Regulatory Bureau, Municipal Bureau of Economy and Information Technology)
9. Encourage insurance institutions to set up enterprise epidemic insurance, and pay a certain amount of compensation for enterprises that are insured and stop production or business due to sudden epidemic. Vigorously promote inclusive commercial health insurance to provide supplementary protection for basic medical insurance. Accelerate the landing of new business insurance pilot products such as platform economy and sharing economy. (Responsible units: Beijing Banking Insurance Regulatory Bureau, Municipal Financial Supervision Bureau, Municipal Medical Insurance Bureau, Municipal Economic and Information Bureau, Municipal Human Resources and Social Security Bureau, Beijing Economic and Technological Development Zone Administrative Committee, and district governments)
(6) Optimize the business environment "grounding gas"
10. Introduce some measures to help enterprises out of difficulties and optimize the business environment, expand the application of online examination and approval services, electronic seals and electronic licenses, improve the service level of "one network to run", and realize the policy of "taking the initiative", "speeding up" and "facilitating". If the production license of industrial products expires during the epidemic period, the validity period will be automatically extended after the online commitment of the enterprise. If the food production license (non-special food) expires, the validity period will be extended by 6 months. If the food production license (special food) and food business license cannot be renewed in time in the closed control area, the validity period will be extended to 30 days after the closure control is lifted. Acts of dishonesty caused by the epidemic, such as administrative punishment and deferred repayment of loans, are not included in credit records and credit records, and convenient services for enterprises that have been subjected to administrative punishment and publicized are opened. Make good use of the 12345 enterprise service hotline to provide enterprises with policy consultation, acceptance and handling, supervision and feedback, and return visit to evaluate the whole chain service, so as to realize "enterprises have a call and the government should respond". (Responsible units: Municipal Development and Reform Commission, Municipal Affairs Service Bureau, Municipal Economic and Information Bureau, Municipal Market Supervision Bureau, Beijing Economic and Technological Development Zone Administrative Committee, and district governments)
11. Consolidate the three-level "service package" work system of city, district and street (township), improve the visiting service system, actively play the role of industry and territorial stewards, improve the dynamic solution mechanism of enterprise demands, and continuously improve the development ability of governments at all levels to coordinate services for enterprises. Stabilize the development of headquarters enterprises in Beijing and guide enterprises to arrange a number of major projects in Beijing that are in line with the strategic positioning of the capital city. Support the development of innovative enterprises, increase support in R&D innovation, scenario application, financing and listing, and accelerate the cultivation of a number of unicorn, "specialized and innovative" and "invisible champion" enterprises. (Responsible units: Municipal Development and Reform Commission, departments in charge of various industries, Beijing Economic and Technological Development Zone Administrative Committee, and district governments)
12. Carry out the special action of clearing the debts of small and medium-sized enterprises. If there is no disagreement and the debts are found to be paid together, the repayment plan will be clarified before June 30, 2022, and it is strictly forbidden for government investment projects to be in arrears. (Responsible units: Municipal Economic and Information Technology Bureau, Municipal Finance Bureau, Municipal State-owned Assets Supervision and Administration Commission, Municipal Development and Reform Commission, Municipal Market Supervision Bureau, Beijing Economic and Technological Development Zone Administrative Committee, and district governments)
13. Accelerate the progress of fiscal expenditure, reduce general expenditures such as meetings, training and travel, and fully recover all kinds of surplus carry-over funds in accordance with regulations, and make overall plans for areas in urgent need such as epidemic prevention and control, helping enterprises to bail out difficulties, etc. (Responsible units: Municipal Finance Bureau, municipal departments, Beijing Economic and Technological Development Zone Administrative Committee, district governments)
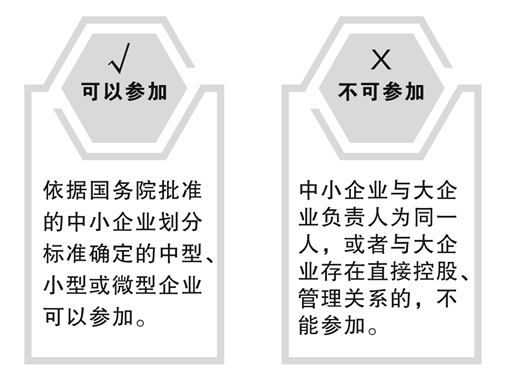
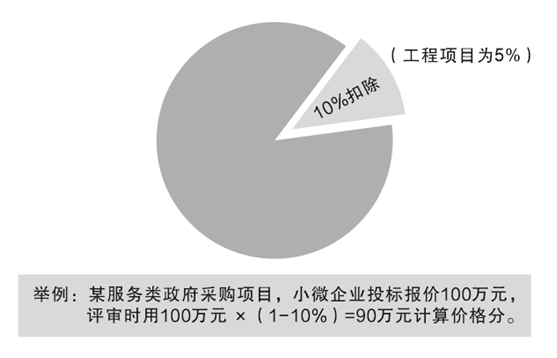
14. Increase the inclination of public procurement, and expand the consortium bidding and reasonable subcontracting for government procurement projects, so as to lower the participation threshold of small and medium-sized enterprises. Increase the price deduction ratio of government procurement of goods and services for small and micro enterprises to 10%-20%. For goods and services procurement projects with more than 2 million yuan and engineering procurement projects with more than 4 million yuan, more than 40% of the total budget is reserved for small and medium-sized enterprises, and the proportion reserved for small and micro enterprises is not less than 70%. Trade union funds and other public funds shall be implemented with reference. (Responsible units: Municipal Finance Bureau, Municipal Bureau of Economic and Information Technology, Municipal Housing and Urban-Rural Development Committee, Municipal Development and Reform Commission, Municipal Federation of Trade Unions, Beijing Economic and Technological Development Zone Administrative Committee, and district governments)
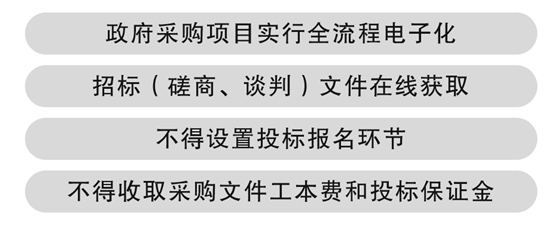
15. Fully promote electronic bidding. If it is difficult to determine the bid evaluation experts by random sampling during the epidemic period, the tenderee may determine the experts for bid evaluation according to law. We will fully implement letter of guarantee (insurance) instead of cash to pay deposit, and encourage tenderers (purchasers) to exempt small and medium-sized enterprises with good credit from bid guarantee. (Responsible unit: relevant industry authorities, municipal public resources trading center)
Second, focus on getting through key blocking points to promote the safety and stability of the industrial chain supply chain.
(1) Effectively coordinating epidemic prevention and control, production and operation.
16. Actively, steadily and orderly promote the resumption of work and production, adhere to the general policy of "dynamic clearing", and implement social prevention and control measures in different regions and levels. Update and dynamically adjust the epidemic prevention and control guidelines according to the scene classification, and timely solve the practical difficulties caused by the epidemic prevention and control of enterprises that have resumed work, supporting enterprises to resume work, logistics and transportation, and returning to Beijing. Guide more enterprises to formulate closed-loop production plans, optimize production processes with minimum production units, minimum personnel grouping, and staggered shifts, so as to improve the ability of enterprises to resist the impact of the epidemic. The living quarters and construction areas of major projects will be managed separately, and new employees in Beijing will live in independent areas to ensure that the construction progress will not be delayed and the quality will not be discounted. (Responsible unit: municipal departments and district governments)
17. Improve the "white list" system for key enterprises with hierarchical classification and dynamic management, strive for more key enterprises in this city and upstream and downstream enterprises to be included in the "white list" protection scope of the national industrial chain supply chain, and establish a "white list pool" for enterprises with mutual recognition, interoperability, mutual supply and mutual insurance in Beijing, Tianjin and Hebei. Establish a "white list" of two important functional enterprises, epidemic prevention materials production enterprises, urban operation guarantee enterprises, industrial chain leaders and supply chain front-end enterprises in urban areas. (Responsible units: prevention and control group for resumption of work and production, Beijing-Tianjin-Hebei Cooperation Office, relevant industry authorities, Beijing Economic and Technological Development Zone Management Committee, and district governments)
(2) Make every effort to ensure smooth communication.
18. Strictly implement the "white list" system for drivers and passengers of freight vehicles and the closed-loop management mode of "taking, leaving and chasing", and accurately assign codes to the green belt * number of communication itinerary cards. Increase the issuance of national unified standard passes, and all enterprises that guarantee the transportation of people’s livelihood materials and productive materials should be issued. For short-board projects of public and basic logistics infrastructure and cold chain logistics facilities construction projects, we will increase the municipal government’s fixed assets investment and local government’s special bond support. Make preparations for the opening of emergency materials transfer stations in the city and Hebei Province at any time, and the construction and operation funds shall be borne by government funds. Study and establish a tripartite sharing mechanism for the transportation cost difference of key goods such as mining and construction materials "revolving iron" among the government, railway departments and enterprises. We will continue to implement the policy of exempting vegetables and some types of domestic fruits from entrance fees in the wholesale market. (Responsible units: Municipal Transportation Commission, Municipal Public Security Bureau, Municipal Health and Wellness Commission, Municipal Communications Administration, Municipal Finance Bureau, Municipal Development and Reform Commission, Municipal Bureau of Commerce, Municipal Housing and Urban-Rural Development Commission, Municipal Economic and Information Technology Bureau, Beijing Economic and Technological Development Zone Administrative Committee, and district governments)
19. Implement the national financial subsidy policy for domestic passenger flight operation in stages in 2022. We will resume domestic and international air passenger flights in this city in a safe and orderly manner, and actively strive to open more flights on international freight routes in this city. In view of the demand for high-end supply chains such as biomedicine, integrated circuits, consumer electronics and automobiles, some financial subsidies will be given to aviation enterprises to increase all-cargo flights, improve ground supporting services and actively reduce aviation logistics costs. (Responsible unit: Municipal Development and Reform Commission, Municipal Finance Bureau, relevant industry authorities)
(3) Accelerate the layout of industrial chains in key areas of Beijing-Tianjin-Hebei cooperation.
20. Carry out the action of strengthening the chain of high-tech industries, and provide a package of support for leading enterprises to improve the supply and demand capacity of the industrial chain in Beijing, Tianjin and Hebei around key areas. Make full use of industrial guidance funds and other means to promote a number of emerging industrial projects such as new energy vehicles, biomedicine, next-generation information technology and industrial internet to land in the modern capital metropolitan area. Promote the construction of the Beijing-Tianjin-Hebei National Technology Innovation Center, and promote in-depth cooperation among the three places in industrial common technology research and development and application of results. (Responsible units: Municipal Bureau of Economic and Information Technology, Municipal Science and Technology Commission, Zhongguancun Management Committee, Beijing-Tianjin-Hebei Cooperation Office, Municipal Finance Bureau)
Third, give full play to the leading role of advantageous enterprises and continuously improve the development level of high-tech industries.
(A) to promote the healthy and sustainable development of platform enterprises.
21. Support platform enterprises to participate in the construction of smart cities and land a number of smart transportation, smart business districts, smart blocks and smart home application scenarios. Guide the scientific and technological transformation of key platform enterprises, support enterprises to cooperate with national laboratories, state key laboratories, new research and development institutions and universities, accelerate technological research and development breakthroughs in artificial intelligence, cloud computing, blockchain, operating systems and processors, and support platform enterprises to participate in the construction of new computing systems. Support platform enterprises to promote digital retail, social e-commerce, online fitness, online diagnosis and treatment, cloud tourism, cloud exhibition, cloud performance and other new digital economic models, expand the "internet plus" consumption scene, and accelerate the integrated development of home life and home office. Support the listing of local enterprises in Hong Kong, and promote the overseas listing of qualified platform enterprises according to laws and regulations. (Responsible units: Municipal Bureau of Economic and Information Technology, Municipal Development and Reform Commission, Municipal Science and Technology Commission, Zhongguancun Management Committee, Municipal Bureau of Commerce, Municipal Health and Wellness Commission, Municipal Bureau of Culture and Tourism, Municipal Financial Supervision Bureau, Beijing Securities Regulatory Bureau)
(B) Support the development of innovative enterprises
22. Increase financing support for innovative enterprises, unblock S funds to expand secondary market transactions such as mergers and acquisitions by relying on Beijing Equity Exchange and Beijing Equity Exchange Center, support financial institutions to strengthen cooperation with external investment institutions according to laws and regulations, actively explore diversified financial service models, and guide private equity funds and venture capital institutions to increase financing support for science and technology enterprises. Optimize the application process and use conditions of the special product "Jingchuangtong" for bill rediscount of science and technology enterprises. (Responsible units: Municipal Financial Supervision Bureau, Beijing Securities Regulatory Bureau, Business Management Department of People’s Bank of China, Beijing Banking Insurance Regulatory Bureau, Municipal Bureau of Economy and Information Technology, Municipal Science and Technology Commission, Zhongguancun Management Committee and Municipal State-owned Assets Supervision and Administration Commission)
23. Accelerate the disbursement of funds for science and technology projects in Beijing, revise the series of financial support policies for Zhongguancun National Independent Innovation Demonstration Zone, implement application policies such as "the first set", "the first batch" and "the first stream", and increase support for enterprise technology research and development investment, achievement transformation and concept verification. (Responsible units: Municipal Science and Technology Commission, Zhongguancun Management Committee, Municipal Economic and Information Bureau, Municipal Development and Reform Commission, Municipal Finance Bureau, Beijing Economic and Technological Development Zone Management Committee, and district governments)
24. Support the landing of a number of intelligent and green digital technological transformation projects, give grading support of no more than 30% of the total investment to qualified "Xinzhizhao100" projects and green and low-carbon projects, and give rewards of no more than 20% of the contract value to "specialized and innovative" digital empowerment projects for small and medium-sized enterprises. (Responsible unit: Municipal Bureau of Economic and Information Technology, Municipal Finance Bureau)
25. For enterprises in regions and industries that are seriously affected by the epidemic to apply for listing on the Beijing Stock Exchange and the national share transfer system, the docking of special personnel will be implemented, that is, the report will be tried immediately and the trial will be issued immediately. Support the Beijing Stock Exchange to waive the annual listing fee for listed companies in 2022, strengthen the submission of electronic materials in the review process, and appropriately accommodate enterprises whose performance has fallen sharply due to the epidemic. (Responsible units: Beijing Securities Regulatory Bureau, Municipal Financial Supervision Bureau, Xicheng District Government)
(C) "two areas" to promote the development of foreign trade
26. Further promote the opening of the whole industrial chain and the reform of all links in key areas of the "two zones", strengthen the protection of land, water and energy for foreign-funded projects, and support foreign-funded R&D centers registered in specific areas of Zhongguancun National Independent Innovation Demonstration Zone to enjoy tax concessions on technology transfer income in accordance with relevant regulations. Support high-tech enterprises such as "specialization and novelty", enterprises recognized by the state as high-tech enterprises and foreign trade enterprises registered in the free trade zone to explore the international market, study and promote the opening and operation of China-Europe trains, and realize "one thing" integrated services for customs clearance matters such as document declaration and cargo inspection. Do a good job in helping foreign trade enterprises out, make good use of the short-term export credit insurance tools of China Export Credit Insurance Corporation, increase the inclination to small and medium-sized micro-foreign trade enterprises, reduce the comprehensive guarantee rate of foreign trade guarantee service platform enterprises to below 1.5%, and discount 50% for enterprises to use trade financing under the pledge of export credit insurance policies and financing through foreign trade guarantee service platform within the limit. Establish a comprehensive service management platform for foreigners, and integrate the work permit and work and residence permit business for foreigners in China. (Responsible units: Municipal Bureau of Commerce, Municipal Investment Promotion Center, Municipal Development and Reform Commission, Municipal Science and Technology Commission, Zhongguancun Management Committee, Municipal Financial Supervision Bureau, Business Management Department of People’s Bank of China, Beijing Banking Insurance Regulatory Bureau, Municipal Finance Bureau, Beijing Customs, Municipal Public Security Bureau, Beijing Economic and Technological Development Zone Management Committee, and district governments)
Fourth, promote the construction of major projects and increase effective investment.
(1) Focus on expanding investment in key areas.
27. Expand productive investment, accelerate the construction progress of key functional areas and urban sub-centers, and promote the completion of a number of major projects in the fields of integrated circuits, new energy vehicles, medicine and health, such as the upgrading of Beijing Benz automobile manufacturing and BOE Life Science and Technology Innovation Center. Forward-looking layout of new infrastructure, promote the construction of super computing centers such as Chaoyang and Haidian, start construction of Beijing Yuanbo Digital Economy Industrial Park, Zhongguancun Jingxi Artificial Intelligence Innovation Center and other projects, and accelerate the construction and deployment of integrated pico-base station systems. (Responsible units: Municipal Economic and Information Technology Bureau, Municipal Science and Technology Commission, Zhongguancun Management Committee, Municipal Development and Reform Commission, Municipal Communications Administration, Beijing Economic and Technological Development Zone Management Committee, and relevant district governments)
28. Stimulate the vitality of urban renewal investment, promote the introduction of urban renewal regulations, establish a cross-project overall implementation mechanism, and reasonably guide the functional mixing of blocks, land use compatibility and architectural function transformation. We will introduce planning land incentive policies such as revitalizing the use of existing state-owned construction land and mixing functions. The policy of rebuilding dilapidated buildings was introduced, and the scale of the complete renovation project of dilapidated buildings must meet the requirements of building scale control, and each district should file it separately. In addition to improving living conditions, the scale increase can be used to build shared property houses or affordable rental houses. Strive to start 300 projects and complete 100 old residential renovation projects in 2022, and introduce social capital to participate in 40 old residential renovation pilot projects. (Responsible units: Municipal Housing and Urban-Rural Development Committee, Municipal Planning and Natural Resources Committee, and district governments)
29. Formulate an implementation plan to promote the construction of modern infrastructure system, sort out and form a list of major projects to be started during the year in the fields of rail transit, energy, water supply, logistics facilities, etc., and submit for approval in advance to implement the qualified rail transit phase III project. We will promote substantial progress in major projects such as Anli Road, Chengping Expressway, Jingmi Expressway, Lize Terminal, Hot Spring Water Plant, and Wenchao River Reduction. Plan a number of new major projects around the areas of smooth traffic connection in key functional areas, filling the shortcomings of urban internal infrastructure, and upgrading and upgrading old pipe networks. (Responsible units: Municipal Development and Reform Commission, Beijing-Tianjin-Hebei Cooperation Office, Municipal Major Projects Office, Municipal Transportation Commission, Municipal Urban Management Committee, Municipal Water Affairs Bureau, Municipal Bureau of Commerce and relevant district governments)
(B) continue to stimulate private investment
30. During the year, private capital participation projects in key areas were publicly introduced to the public in two batches. By the end of June 2022, the first batch of projects were introduced with a total investment of more than 100 billion yuan. Support the state-owned capital operation platform to reasonably expand the financing scale, focusing on strategic industries and major projects in this city. (Responsible units: Municipal Development and Reform Commission, Municipal State-owned Assets Supervision and Administration Commission and district governments)
(3) Improve the landing efficiency of investment projects
31. Strengthen the examination and approval service and factor guarantee of investment projects, simplify and speed up the examination and approval procedures for major investment projects by means of informing commitments and accepting vacancies. Optimize the examination and approval procedures of government investment projects, which involve the balance of cultivated land occupation and compensation and the occupation of forest land and green space, and be guaranteed through land reclamation and municipal overall planning. In the first half of the year, the second batch of commercial residential land will be supplied centrally, and in the second half of the year, two batches of land supply will be completed, and the construction of affordable housing projects will be accelerated. Formulate a work plan to further coordinate the planning and reserve of special bonds and other projects. In 2022, the special bonds will be issued before the end of June and basically used before the end of August, and the physical workload will be formed as soon as possible. Promote the issuance and listing of more qualified real estate investment trust funds (REITs) projects in the infrastructure sector. Strengthen the docking with policy development banks, support the use of insurance funds in Beijing, and strive for more medium and long-term loans and long-term funds to support the construction of major projects in this city. (Responsible units: Municipal Development and Reform Commission, Municipal Planning and Natural Resources Commission, Municipal Bureau of Landscaping and Greening, Municipal Bureau of Ecology and Environment, Municipal Water Affairs Bureau, Municipal Housing and Urban-Rural Construction Committee, Municipal Finance Bureau, Business Management Department of People’s Bank of China, Beijing Banking Insurance Regulatory Bureau, Beijing Securities Regulatory Bureau, Beijing Economic and Technological Development Zone Management Committee, and district governments)
32. Strengthen the planning and reserve of major projects, complete the collection and reserve of two batches of major investment projects in combination with the "14th Five-Year Plan" year, do the preparatory work and ensure the real factors, and promote the construction of a number of major projects in the approval stage of construction application in advance, forming a rolling succession mechanism of "implementing one batch, reserving one batch and planning one batch". (Responsible units: Municipal Development and Reform Commission, relevant industry authorities, Beijing Economic and Technological Development Zone Administrative Committee, and district governments)
Five, speed up the recovery of bulk consumption and new consumption, and make greater efforts to tap the consumption potential.
(1) Vigorously promote mass consumption such as automobiles.
33. For passenger cars with a displacement of 2.0 liters or less whose purchase date is from June 1 to December 31, 2022 and the bicycle price (excluding value-added tax) does not exceed 300,000 yuan, the vehicle purchase tax will be levied by half. We will introduce some measures to promote the circulation of used cars, and improve the policy of eliminating and updating old motor vehicles. Before the end of 2022, passenger cars that have been scrapped or transferred out of the city and registered in my name for more than one year will be purchased in the automobile sales enterprises in this city, and individual consumers who are licensed in this city will be given a subsidy of no more than 10,000 yuan/set, and the required funds will be borne by the urban two levels of finance respectively. (Responsible units: Municipal Bureau of Commerce, Beijing Taxation Bureau, Municipal Transportation Commission, Municipal Bureau of Ecology and Environment, Municipal Public Security Traffic Management Bureau, Municipal Bureau of Economy and Information Technology, Municipal Finance Bureau, Beijing Economic and Technological Development Zone Administrative Committee, and district governments)
34. Adhere to the principle of "housing without speculation", ensure the demand for rigid housing, meet the reasonable demand for improved housing, and stabilize land prices, house prices and expectations. Promote enterprises to convert existing commercial housing into talent rental housing and affordable rental housing supporting key functional areas and industrial parks. Relying on the intelligent information collection system, establish a "white list" system for home improvement enterprises and home improvement personnel, implement the requirements of "one boarding and three inspections" for employees of "bulk construction", safely and orderly release home decoration construction, and effectively promote home improvement, home and household appliances consumption. (Responsible units: Municipal Housing and Urban-Rural Development Committee, Municipal Planning and Natural Resources Committee, Municipal State-owned Assets Supervision and Administration Commission, Municipal Bureau of Commerce, Beijing Economic and Technological Development Zone Administrative Committee, and district governments)
(B) actively cultivate new digital consumption
35. Formulate and implement a work plan to promote the energy level of digital consumption, list the occupations that are in urgent need of shortage in the field of live broadcast e-commerce in the relevant human resources catalogue of this Municipality, and encourage all districts to give rent subsidies and financial incentives to qualified high-quality live broadcast e-commerce service institutions. Promote the speed-up and fee reduction of office and home networks. A new batch of green energy-saving consumer vouchers will be collected from participating enterprises, a number of applicable electronic product models will be added, the policy implementation cycle will be extended, and products such as smart office, smart home and mobile smart terminals will be developed and promoted with preferential promotions. (Responsible units: Municipal Bureau of Economic and Information Technology, Municipal Bureau of Commerce, Municipal Bureau of Human Resources and Social Security, Municipal Communications Administration, Municipal Finance Bureau, Beijing Economic and Technological Development Zone Administrative Committee, and district governments)
(3) Promote the recovery of consumption of catering, culture, sports and entertainment.
36. Promote the resumption of development of catering enterprises, issue catering vouchers jointly with take-away platform enterprises, and subsidize the expenses related to the suspension of restaurant catering merchants reduced by platform enterprises in June 2022. For catering enterprises included in the development projects and support scope of the city’s life service industry, the maximum financial support is 50% of the actual investment. Encourage all districts to give certain subsidies to the environmental regular nucleic acid detection expenses and daily epidemic prevention expenses of catering enterprises in combination with the actual situation. (Responsible units: Municipal Bureau of Commerce, Municipal Finance Bureau, Administrative Committee of Beijing Economic and Technological Development Zone, and district governments)
37. Hold the 10th Huimin Cultural Consumption Season and promote cultural consumption. Encourage tourism platform enterprises and travel agencies to develop summer youth outdoor sports, popular science, culture and other practical projects. Create 20 "Summer in Beijing Suburbs" rural tourism boutique routes, and launch 10 "micro-holiday" destinations such as Yanqing Summer Resort and Miyun Leisure. Support the development of boutique homestays, and each ecological conservation area will land 1-2 ecological cultural tourism projects during the year. (Responsible units: Municipal Bureau of Culture and Tourism, Propaganda Department of Municipal Party Committee, Municipal Sports Bureau, Municipal Finance Bureau, Municipal Bureau of Commerce, Municipal Cultural Resources Center, and district governments)
Sixth, take multiple measures to broaden employment channels and firmly grasp the bottom line of social and people’s livelihood.
(1) Strengthen the employment service guarantee for key groups.
38. This year and next, the state-owned enterprises in this Municipality will achieve a certain proportion of growth in recruiting college graduates, and stabilize the scale of recruiting college graduates in the organs and institutions affiliated to this Municipality. Excavate a number of jobs such as grassroots pension services and social work, and support universities, research institutes and enterprises to expand the scale of research assistant positions. Support people with college education or above to apply for community workers, rural revitalization assistants in ecological conservation areas and nursing posts in community health service centers. (Responsible units: Municipal Human Resources and Social Security Bureau, Municipal State-owned Assets Supervision and Administration Commission, Municipal Science and Technology Commission, Zhongguancun Management Committee, Municipal Education Commission, Municipal Health and Wellness Commission, Civil Affairs Bureau, Municipal Finance Bureau, Beijing Economic and Technological Development Zone Management Committee, and district governments)
39. Employers recruit college graduates from this city in the graduation year, and those who meet the requirements will be given social insurance subsidies. Recruiting college graduates in this city in the graduation year, signing labor contracts and participating in unemployment insurance will be given a one-time subsidy of 1,500 yuan per person, and the implementation period of the policy will be until the end of 2022. (Responsible units: Municipal Human Resources and Social Security Bureau, Municipal Finance Bureau, Municipal Education Commission, Beijing Economic and Technological Development Zone Administrative Committee, and district governments)
40. During the year, 50,000 new rural laborers were employed to participate in urban employee insurance. Deepen cross-regional docking and supporting service guarantee, further tap urban job resources, and give priority to absorbing rural labor employment. Strengthen the resettlement of rural public welfare posts, and promote the stable employment of rural labor in the local area. Actively promote seasonal fruits and vegetables in rural areas. (Responsible units: Municipal Human Resources and Social Security Bureau, Municipal Bureau of Agriculture and Rural Affairs, Municipal Bureau of Commerce, Municipal Bureau of Landscaping and Greening, Municipal State-owned Assets Supervision and Administration Commission and relevant district governments)
41. Expand the strength of community work, temporarily recruit employees in industries such as accommodation, catering, recreation, tourism, exhibitions, education and training, retail, etc., participate in the prevention and control of epidemic situation in the community part-time, and give appropriate subsidies. Give play to the role of shared employment platform, timely meet the needs of enterprises for employment adjustment, support platform enterprises to provide flexible employment positions for enterprises affected by the epidemic, such as catering, cultural tourism, exhibitions, etc., and carry out pilot projects for occupational injury protection for employees in new employment forms. (Responsible units: Municipal Human Resources and Social Security Bureau, Civil Affairs Bureau, Municipal Economic and Information Bureau, Municipal Bureau of Commerce, Municipal Finance Bureau, Beijing Economic and Technological Development Zone Administrative Committee, and district governments)
(B) to improve the level of safe operation of the city
42. Complete the three-year action plan to strengthen the construction of the public health emergency management system in the capital, and consolidate and improve the emergency work mechanism of "fighting by districts", "fighting by schools" and "fighting by enterprises". We will continue to strengthen the construction of public health emergency response capacity, and accelerate the construction of epidemic prevention and control infrastructure such as centralized isolation facilities, shelter hospitals, nucleic acid detection facilities, negative pressure wards, fever clinics, first-aid stations, and comprehensive information platforms. We will promote the relocation of the Municipal Center for Disease Control and Prevention, the emergency places for epidemic prevention and control and major events, the public health clinical center, the renovation and upgrading of ditan hospital, and the renovation of public toilets in bungalows. (Responsible units: Municipal Health and Wellness Commission, Municipal Planning and Natural Resources Commission, Municipal Major Projects Office, Municipal Housing and Urban-Rural Development Commission, Municipal Development and Reform Commission, Municipal Urban Management Commission, Municipal Finance Bureau, Beijing Economic and Technological Development Zone Management Committee, and district governments)
43. Do a good job in ensuring the supply and price stability of daily necessities such as rice flour oil, vegetables, meat, eggs and milk. The annual consumer price index rose by about 3%. We will implement a linkage mechanism linking social assistance and security standards with price increases, and pay temporary price subsidies in full and on time when the starting conditions are met. Reasonably raise the minimum living standard of this city in 2022. (Responsible units: Municipal Development and Reform Commission, Civil Affairs Bureau, Municipal Finance Bureau, Municipal Veterans Bureau, Municipal Human Resources and Social Security Bureau, Municipal Bureau of Commerce, Beijing Economic and Technological Development Zone Administrative Committee, and district governments)
44. Ensure food and energy security, timely issue one-time subsidies to farmers who actually grow grain, start grain purchase according to the market situation, and ensure that the planting areas of grain, soybeans and vegetables reach 1 million mu, 42,000 mu and 750,000 mu respectively. Implement the task of storing energy resources such as refined oil by local governments. Accelerate the construction of energy projects in this city. (Responsible units: Municipal Grain and Reserve Bureau, Municipal Agriculture and Rural Bureau, Municipal Urban Management Committee, Municipal Development and Reform Commission, Municipal Bureau of Commerce, Municipal Finance Bureau, and district governments)
45. Deepen the special rectification actions for safety production, carry out the city’s safety inspection in a down-to-earth manner, strictly guard against safety accidents in traffic, construction and gas, carry out special rectification for the safety of self-built houses, and effectively protect people’s lives and property. (Responsible units: Municipal Emergency Bureau, Public Security Traffic Management Bureau of Municipal Public Security Bureau, Municipal Housing and Urban-Rural Construction Committee, Municipal Urban Management Committee, Municipal Fire and Rescue Corps, Beijing Economic and Technological Development Zone Management Committee, and district governments)
This implementation plan shall come into force as of the date of promulgation and shall be valid until December 31, 2022 (if the state has relevant regulations or specific measures specify the implementation period, such regulations shall prevail).


